Hello, everyone. Last week, I wrote about network attack simulation, showing how removing just a few nodes can be very effective at disrupting a small social network. Today, I wanted to try something much more ambitious. Last week, I used the Alice network, which only contained 51 nodes and 67 edges. Today, I decided to do another attack simulation but on a network of 65,260 nodes and 306,509 edges. This is a complex network. I used the arXiv Network Science collaboration network built previously, but the subject of the network doesn’t matter. This has more to do with structure than what the nodes represent.
I had four goals for today’s experiment:
Cause as much disruption to the network as possible
Without destroying it completely
Do it quickly
Be able to investigate the surviving network components
This guided my methodology of attack:
Destroy 500 top key nodes per iteration
Do 50 iterations
Drop all isolate and two-node components at each step
Because of the last part, the network will shrink at each iteration. Nodes that have been disrupted will be dropped. I say that they have been disrupted because isolates are not connected to another node, and a two-node component isn’t much better. So, I will consider isolates and two-node components as having been disrupted. They can no longer communicate with the rest of the network. Information sharing has been disrupted.
Degree Distribution
Before starting, let’s look at the original degree distribution of the original network.
This is a histogram of node degrees (edge count). Most of the network has between fifty edges (connections). Rarely do nodes have more than fifty edges, but there are some.
After the attack is completed, I expect that there will be very few nodes with many edges, as I expect to be able to massively disrupt this network.
Attack Simulation
I have left some code in place so that you can print the dropped nodes if you want, but on my end, the simulation output looks like this:
running loop: 0
Graph with 57619 nodes and 283677 edges
---------------
running loop: 1
Graph with 56438 nodes and 270568 edges
---------------
running loop: 2
Graph with 55415 nodes and 258991 edges
---------------
running loop: 3
Graph with 54379 nodes and 246397 edges
---------------
running loop: 4
Graph with 53542 nodes and 234412 edges
The code itself is simple:
def remove_nodes(G, iterations=50, cut_size=500):

    results = {}

    G = G.copy()

    for i in range(iterations):

        results[i] = {}

        results[i]['nodes'] = len(G.nodes)
        results[i]['edges'] = len(G.edges)

        print('running loop: {}'.format(i))

        cent_df = get_key_node_df(G)

        drop_nodes = sorted(cent_df[0:cut_size].index)

        #print('removing key nodes: {}'.format(drop_nodes))

        G.remove_nodes_from(drop_nodes)

        G = nx.k_core(G, 2) # no isolates or two-node groups

        print(nx.info(G))

        print()
        print('---------------')
        print()

    return G, results
At each step, I track the original node and edge count so that I can later investigate the impact of each step. Let’s look at that.
Because this is a large network, I am using Page Rank instead of Betweenness Centrality to determine key nodes to drop. Page Rank is very fast on large networks, and Betweenness Centrality becomes painfully slow. Use Page Rank to determine importance when Betweenness Centrality becomes unfeasible.
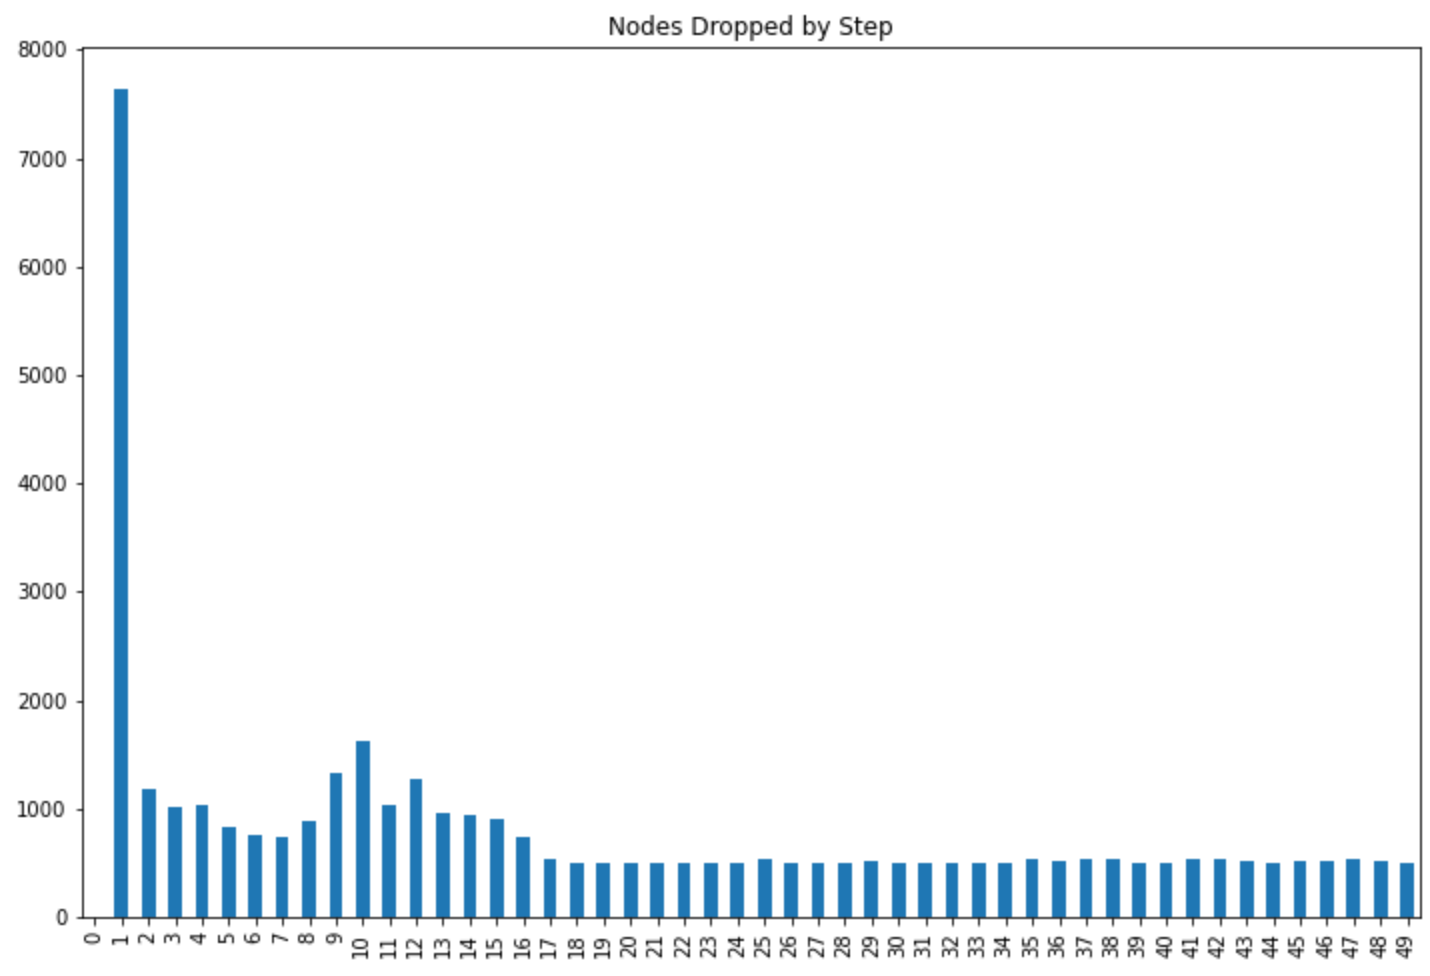
At each step, key nodes are dropped. When key nodes are dropped, many nodes become isolates, as they no longer connect to anything. I drop all isolates and two-node components. Above, you can see that at the first step, nearly 8000 nodes were disrupted, either by being orphaned as isolates or being part of a two-node component. After the initial massive disruption, the network was shattered into pieces (connected components), but there were still more important nodes to attack. Later steps continued to disrupt between 500-2000 nodes per step, eventually stabilizing.
How do the edges look?
When nodes are dropped, all of their edges are dropped as well. This shows the disruption a bit differently than when looking at nodes. The first step removed close to 25,000 edges, but there were two other steps that also caused the removal of nearly as many edges.
Visually, What Happened?
The largest connected component (structure) of the original network does not visualize well, so I will show the second largest. The second largest conveys the point well.
This is the second largest connected component of the original network, before the attack was simulated. Look and see if you can identify weaknesses in the structure. Look for parts that look like could be cut with a pair of scissors, splitting the network into pieces. I can see several. This is the BEFORE image.
This image shows the number of nodes in each of the LARGEST connected components in the original network. Above, I visualized component 816, the one with 121 nodes. The largest component would not be anything to look at. It is too complex for simple network visualization software.
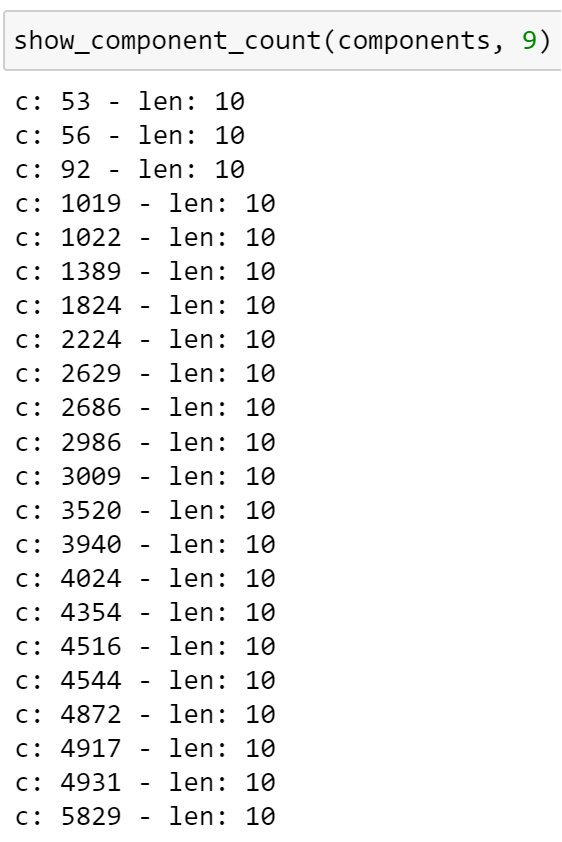
Here are the LARGEST connected component sizes AFTER the attack simulation.
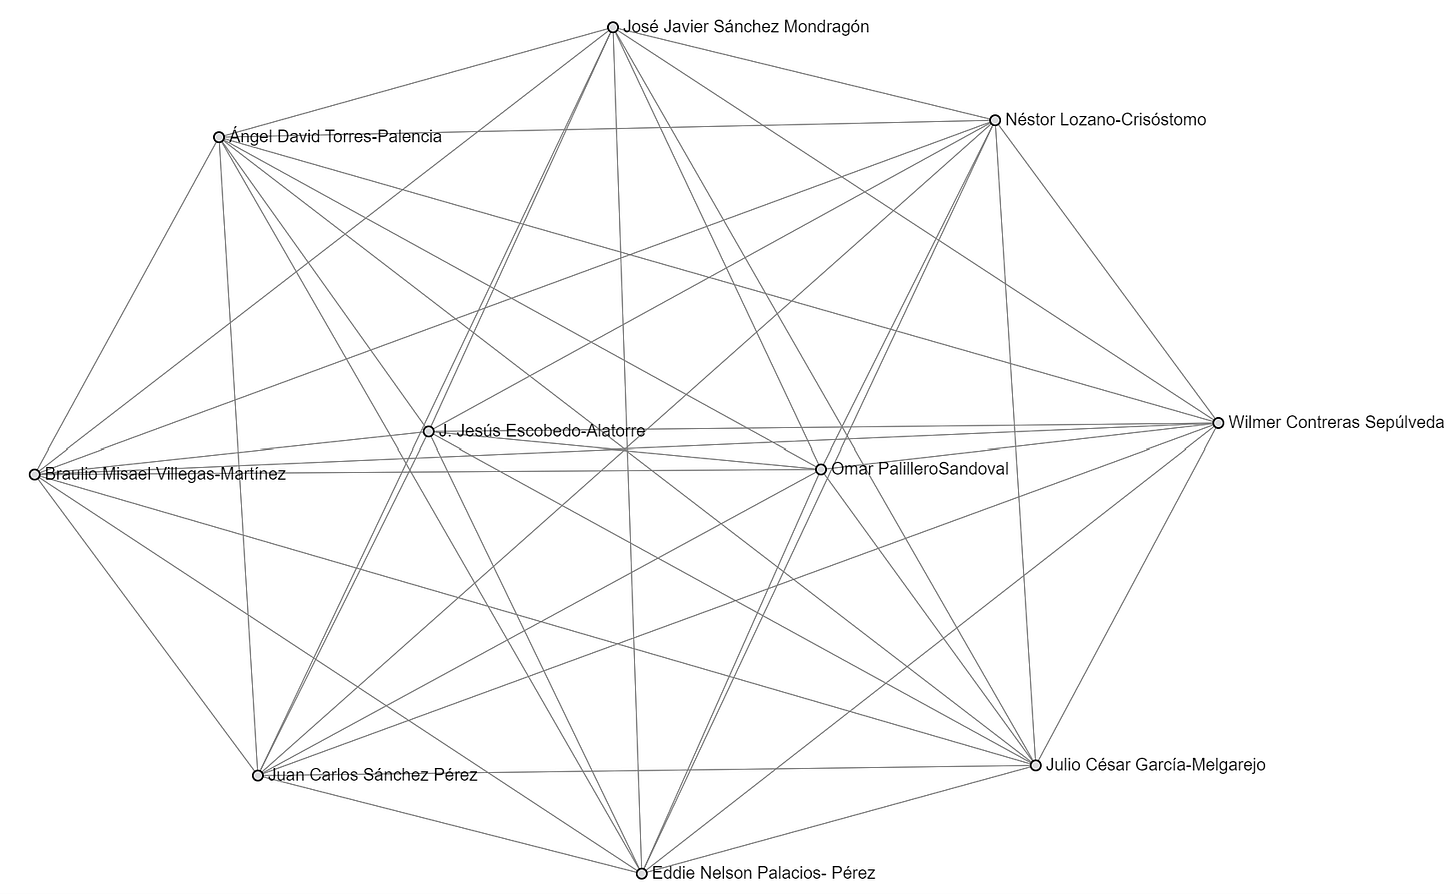
This is devastating. No component larger than 10 nodes haS stayed intact. It’s very interesting that all of the largest components are ten nodes. Nothing more than ten. Why exactly 10? That’s interesting.
Before I show what these look like, let me show you what resilient network structures look like from the original network.
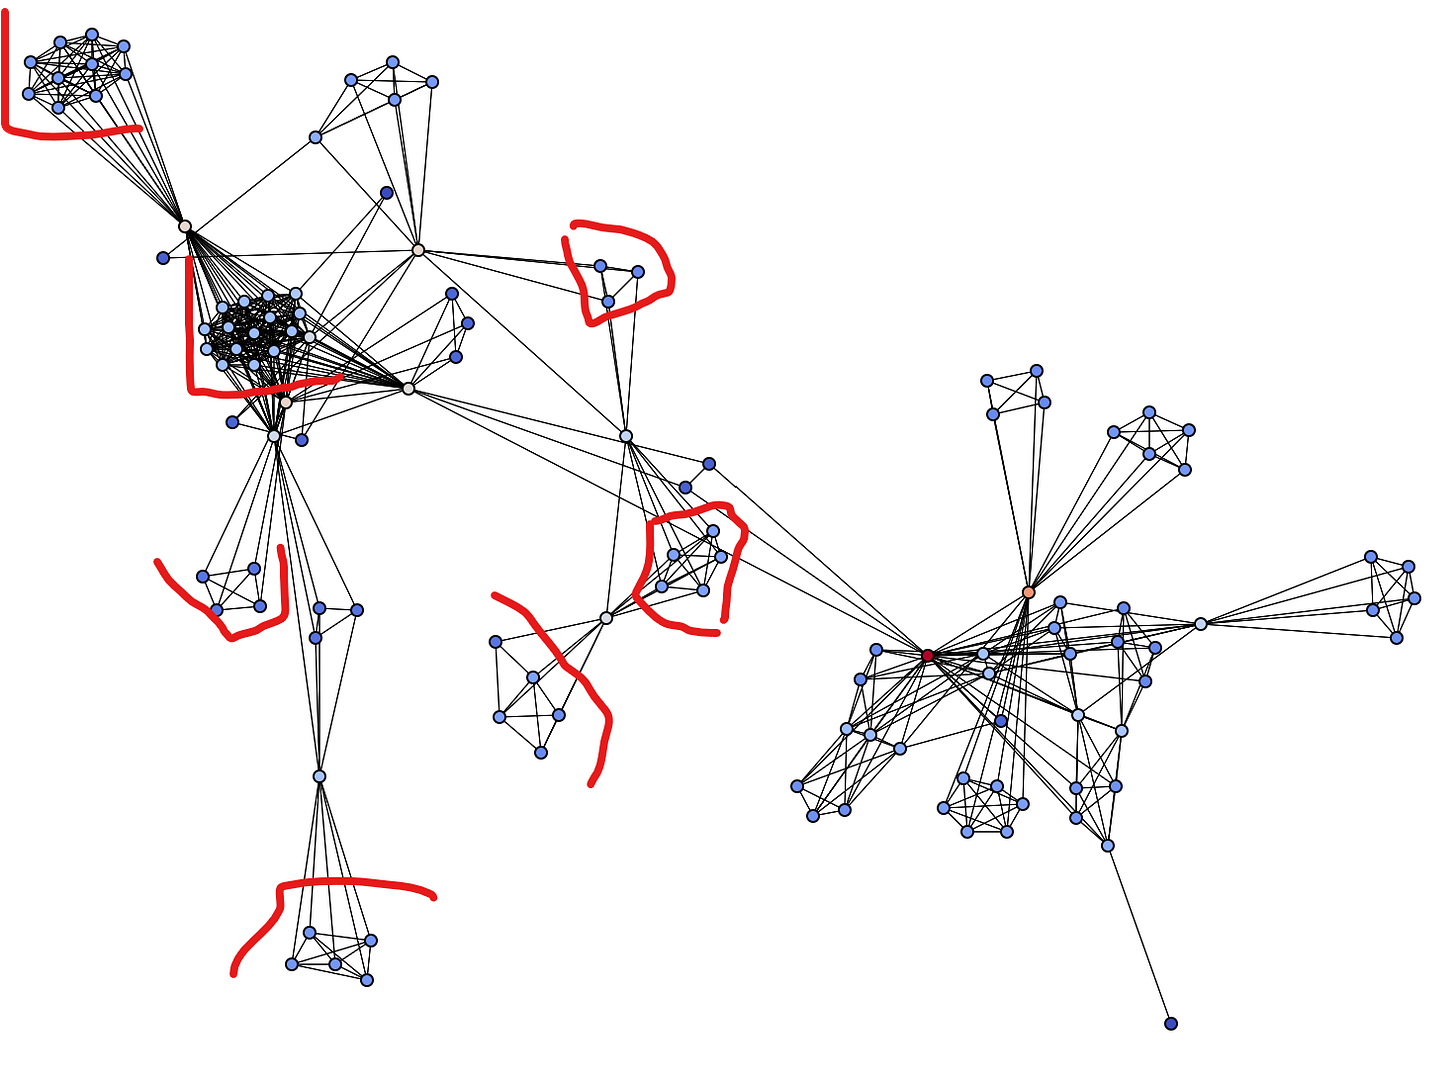
I have highlighted some of the types of structures that are more resilient to attack. They remind me of crystals. When each part of a groups is connected with each other, it has a high density value and is less susceptible to this attack.
So, what the the largest remaining structures of the attacked network look like? Let’s look at a few:
And another:
And another:
What Does This Show?
What’s the takeaway from all of this? Well, networks are all around us and there are different types. However, what this shows is that certain network structures are more susceptible to attack than others, and other structures are more resilient. It shows that a mesh structure can withstand attack better than a star, for instance.
The point is to begin to think about the networks that are around us, to understand how they work, and to have a true understanding of their resiliency or fragility to attack. If you have a “single point of failure”, that’s a key node. That’s likely either a bridge node or part of a star. Think networks. Understand beyond lists. Use networks to think both offensively and defensively.
Oh, and here’s the final results of the simulation.
More than 40,000 nodes were fully disrupted, and nearly 265,000 edges lost in the process. Though the network only lost less than 1/3 of the number of nodes, the impact on edge count (information sharing) is drastic. That network is smashed.
That’s All, Folks!
I will be doing more attack simulation during this iteration of 100daysofnetworks. I suspect that different types of networks are more resilient to attack simulation due to the nature of the network, and I want to explore that idea.
Feel free to play with the code to try different attack simulations. This is only one. Try different approaches. What would smash the higher density areas of the network? I have an idea for another day.
That’s all for today! Thanks for reading! If you would like to learn more about networks and network analysis, please buy a copy of my book!


