
Day 83 of #100daysofnetworks
Punk Rock OSINT: Bipartite Projection

I’m loving this Punk Rock Science feel, so I am going to keep going with it. I had a great time at the Punk Rock show last week, and it proved my World AI works. I’m done proving, and I just use this to enjoy life.
I have also begun onboarding about 20 paying subscribers to the World AI API interfaces, and a few have already begun to use it. Now my readers can do the same things that I’m going to do in this article. Give it a try, and let me know if you need any help. I do not mind at all, because once you learn to walk, you will soon be able to run!
The discount is over. If you would like API access, you can email me at info@verdantintel.com.
Punk Rock OSINT
I love Open Source Intelligence (OSINT). I have done it for years, and it’s not always pleasant. In OSINT investigations, you are often looking at the worst things happening in the world.
OSINT is just “advanced research skills”. It’s like the scene in the movie Taken where the actor describes having a particular set of skills. So do I:
Natural Language Processing
Mapping Things Out (Graph, Social Network Analysis)
Understanding System Behavior (Graph, Network Science)
Cybersecurity, Data Operations, Data Engineering, blah blah blah
In OSINT, you do a lot of different things.
These days, I want to use OSINT to find things to enjoy, not chase things that put me into depression for a month. I had a great time at a Punk Rock show last week, so let’s use some minimalistic OSINT skill to figure out the local Punk Rock ecosystem.
Problem Definition or Target Outcome
In Data Science, you start with a problem definition or a target outcome.
Problem Definition: I am a quiet introvert, and I like aggressive music sometimes. I like punk and grunge and metal and all kinds of things. As I am an introvert, I don’t talk to a lot of people about music, especially locally (I hang out on the internet). I want to use my skill to get around my weaknesses and go enjoy my life.
I am specifically interested in learning two things today:
What artists who are affiliated with Punk Rock have or will pass through Portland, Oregon?
What venues exist in Portland where these artists perform.
Or in other words, I want to know what bands play and I want to know where I need to go to see them perform.
Get Data, Graph It, Do Projection
I’ve already written several articles about my World AI recently, so let’s keep going. This is simple work to do:
Use the GrooveSeeker API to get Punk Rock Data
Put it into a DataFrame
Create a Bipartite Graph
Do Bipartite Projection
Analyze the Projected Graphs
That’s it. This becomes muscle memory if you do it a few times. If you don’t do it at all, it will never become muscle memory, because this is not a commonly talked about technique, and I accidentally found it years ago. I am giving you some rare diamonds here. Here is the code.
What Artists Perform?
It is simple to do Bipartite Projection once you know the steps. It’s just one extra step.
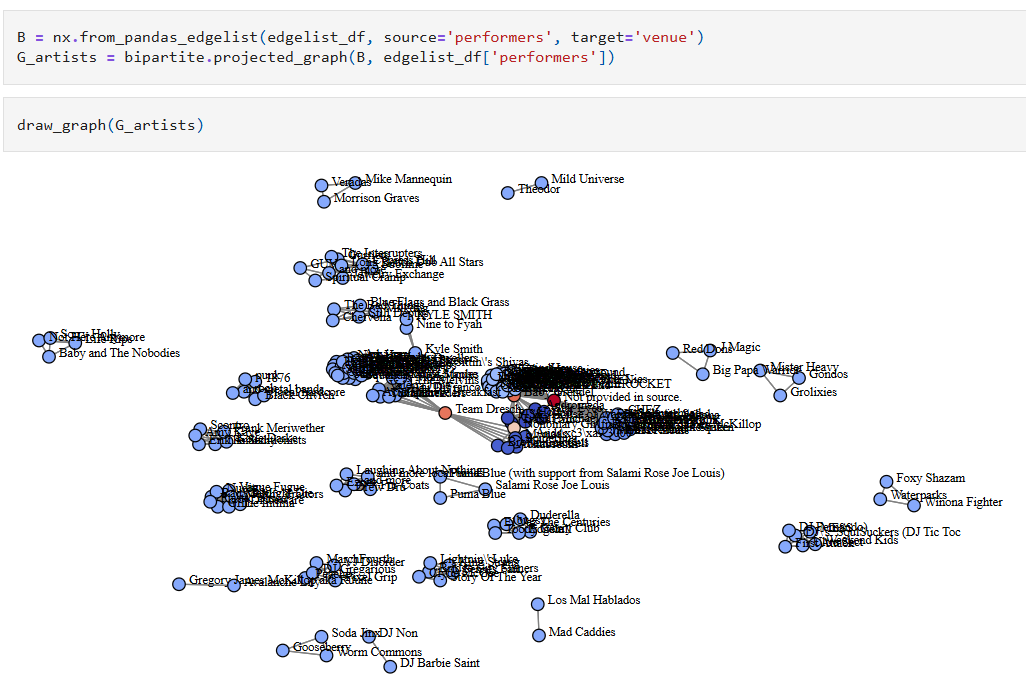
You create the bipartite graph (top), and then you choose the field to use in the projection. In this instance, I used performers. This is a gnarly visualization, but it shows a few things.
I don’t see any isolates. Looks like Punk Rock bands rarely perform alone.
There’s a denser core, and I can see a few bridge nodes, but one of them is “Not provided in source”. That means one of those groups will split in two, and that might be interesting to explore.
There are several dense clusters of artists who seem to do things together. I wonder what the story is. This reminds me of the GraphGeeks topic yesterday of when relationships are more interesting than nodes. These relationships are interesting, and they involve different nodes. Why? Are there Punk Rock cliques? Has any Social Scientist ever researched Punk Rock dynamics?
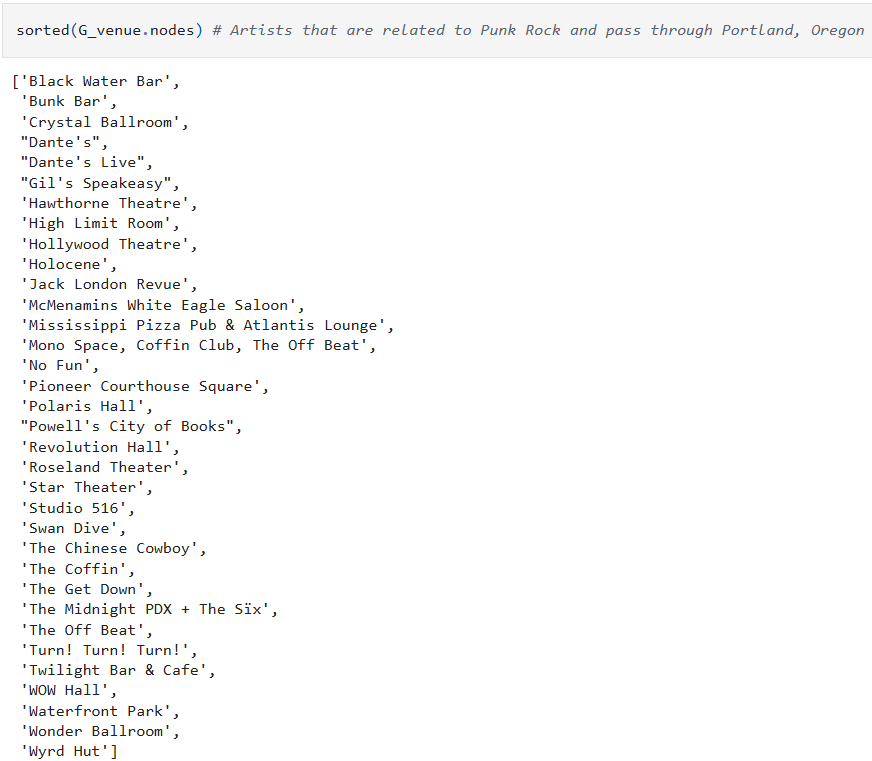
Cool. And since it’s a graph, I can also just explore the artist nodes directly.
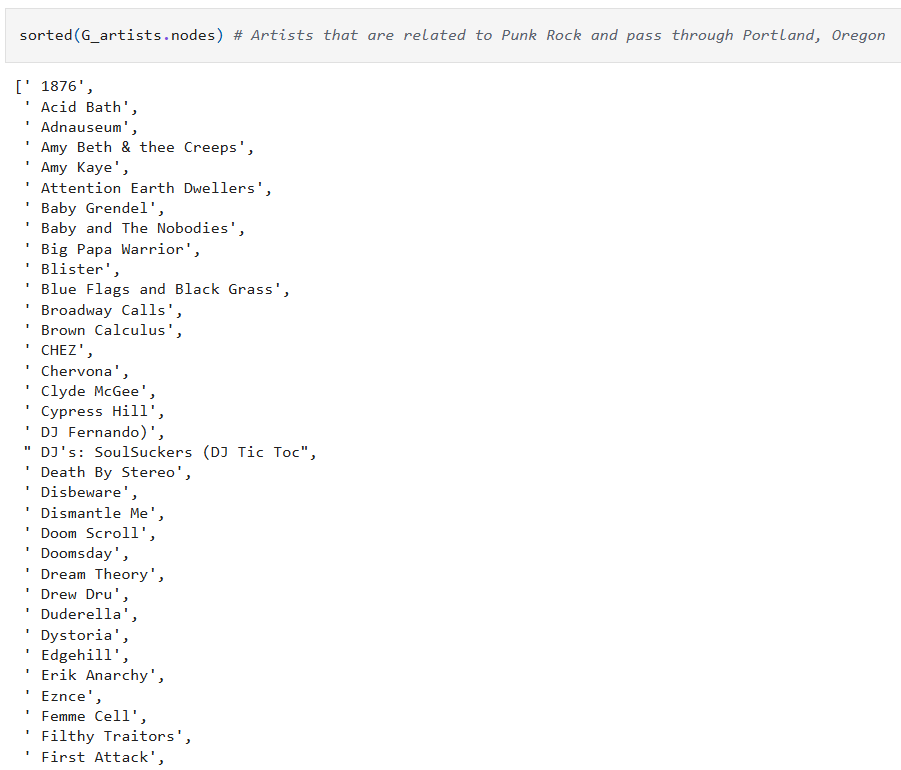
1876! That’s cool! I saw them on Thursday and they were awesome!
Oh cool, Cypress Hill?! I like them a lot. They are not Punk Rock, but they are affiliated. They certainly have the energy. This is event collaboration data—past, present, and future—so I don’t know if they were here in the past or if they are coming here. Neat! I will look, later!
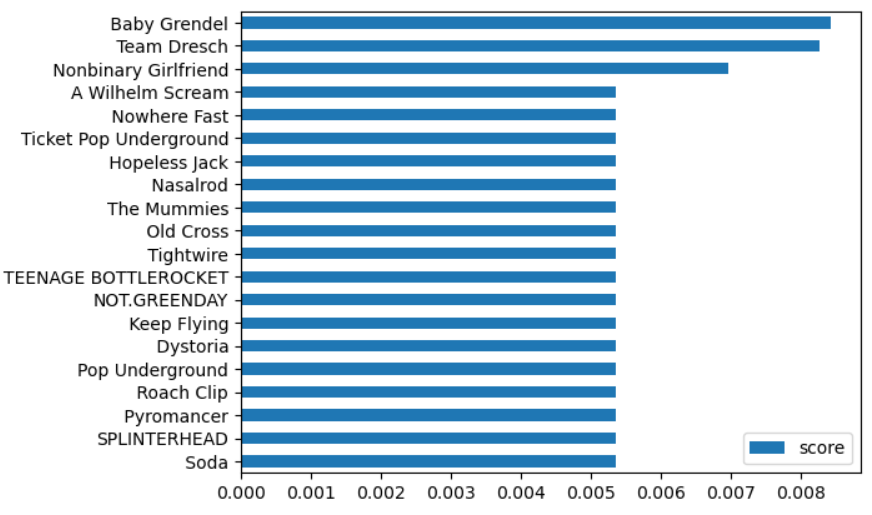
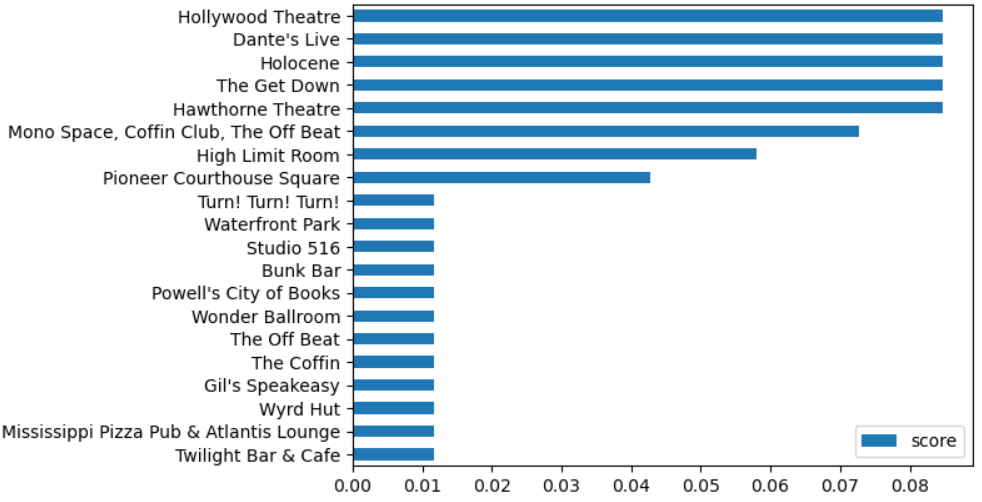
I can easily see who are the most connected artists. I used PageRank.
What Venues Exist?
It is just as easy to map out the venues using bipartite projection.
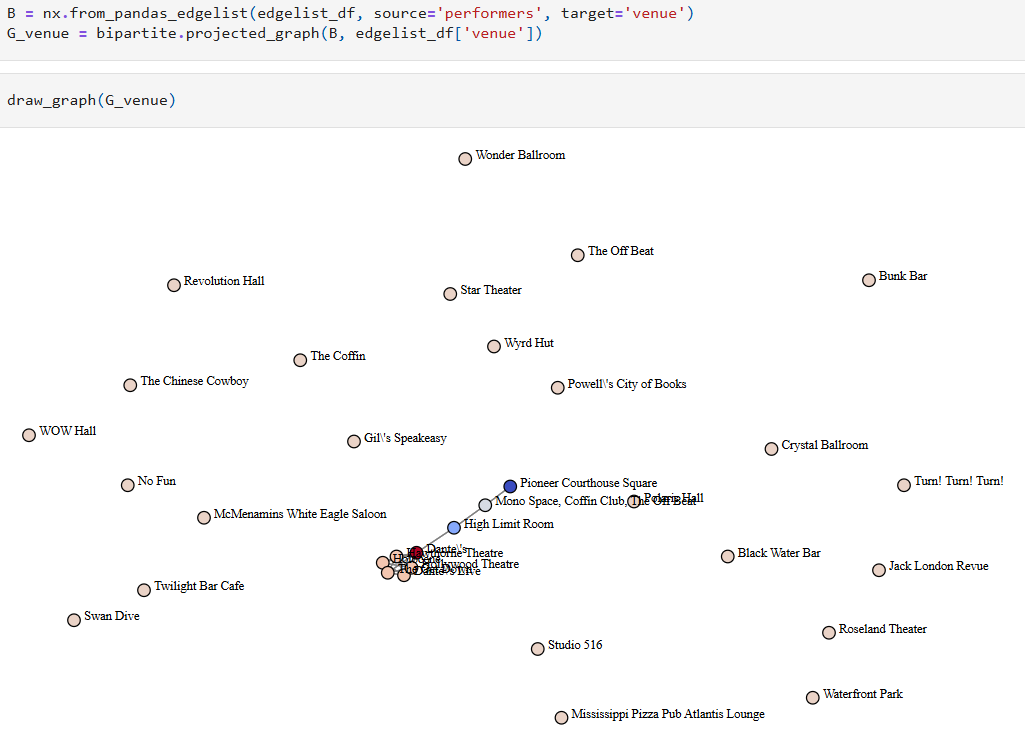
I did the same thing as before, I just used venue instead of performers. See, graphs are like a kaleidoscope. If you simply change the perspective, you can see new things. It’s the same graph, projected differently.
I can see where stuff is happening.
And I can see what venues interact with other venues in some way. I will have to look closer at this. It is interesting. This might be cool. It’s neat when venues work together!
What Are Next Steps?
So, what are my next steps? People often ask what are the next steps after an analysis:
Look up the artists on YouTube and other platforms. Listen to them. Find the ones you like. Then go to their shows! Meet them and talk to them. They are normal people, like you and I. Or just be a fan. That is cool, too!
Look up the venues and figure out which ones are close enough to go to. Look them up online. Looks good? Then find something to enjoy and go.
My next steps are not to tinker and tinker and tinker and tinker with the World AI. It works and is behind an API. I built it to enjoy life, and I gave some people API access so that they would use it to understand the world and/or enjoy life.
That is all for today! Today is Day 2 of 30 Days of Graph with GraphGeeks. The API has made these kinds of investigations incredibly easy, empowering me to write daily. I am enjoying all of this so much.
Have a great day!
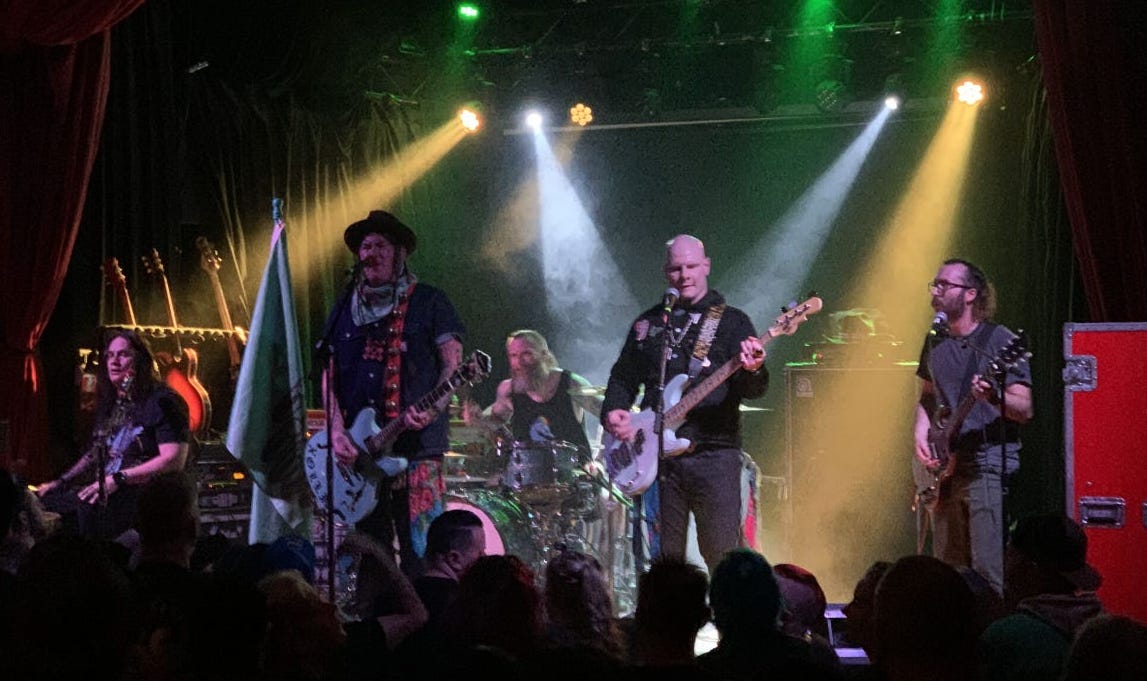
(Local Portland, Oregon band 1876)