
Day 68 of #100daysofnetworks
Exploring Network Science, Social Network Analysis, Graph Databases, and Knowledge Graphs Together

Hi everybody!
I am so excited about today’s article that I can barely sit still. I have been planning this for a few days. Today, we’re going to do something really special. We’re going to bridge the gaps between Network Science, Social Network Analysis, Graph Databases, and Knowledge Graphs. The work behind this article is complicated, so I will use pictures and paragraphs to try to keep this simple.
The minimalistic network science code is available here. I simply constructed the graph and captured each node’s PageRank values so that I could use them in the downstream steps. If you want to go deeper into Network Science, I recommend reading my book or the earlier articles on this blog, as I have already gone deep down that rabbit hole.
Methodology
I will go fast and be concise so as to be as informative as possible. I will:
Show you the results of running the PageRank algorithm across all nodes in the network.
Explore the top nodes in Cosmograph, a graph visualization tool that is million-scale graph visualization, suitable for large network exploration.
Explore the top nodes in my Graph Database to see how they look in a Living Knowledge Graph. This knowledge graph is updated hourly and is available through my company’s Living Library of Knowledge.
What is GrooveSeeker?
If you are new here or just haven’t seen the articles, GrooveSeeker is an Event Intelligence platform, useful for understanding events and scenes (music, art, culture, sports, hackathons, data conferences, all kinds of things). You can use the free website at gsv3.ai.
Please subscribe to its own blog. I write for the GrooveSeeker blog as well.
Let’s Go! Step 1: Top Entities
In my Graph Database, I use an “Entities” node type to tag artists, bands, venues, and other things that participate in events. Naturally, if I look at the Entities with the most links (lines between the dots; links; relationships), Venues will be at the top, as artists perform at venues. Venues will have a one-to-many (1:n) relationship with people and bands who perform at Venues. That is common sense. Venues do not perform at People’s houses.
So, if I look at GrooveSeeker Collaboration Data and use it to identify nodes with highest PageRank values, I see this:
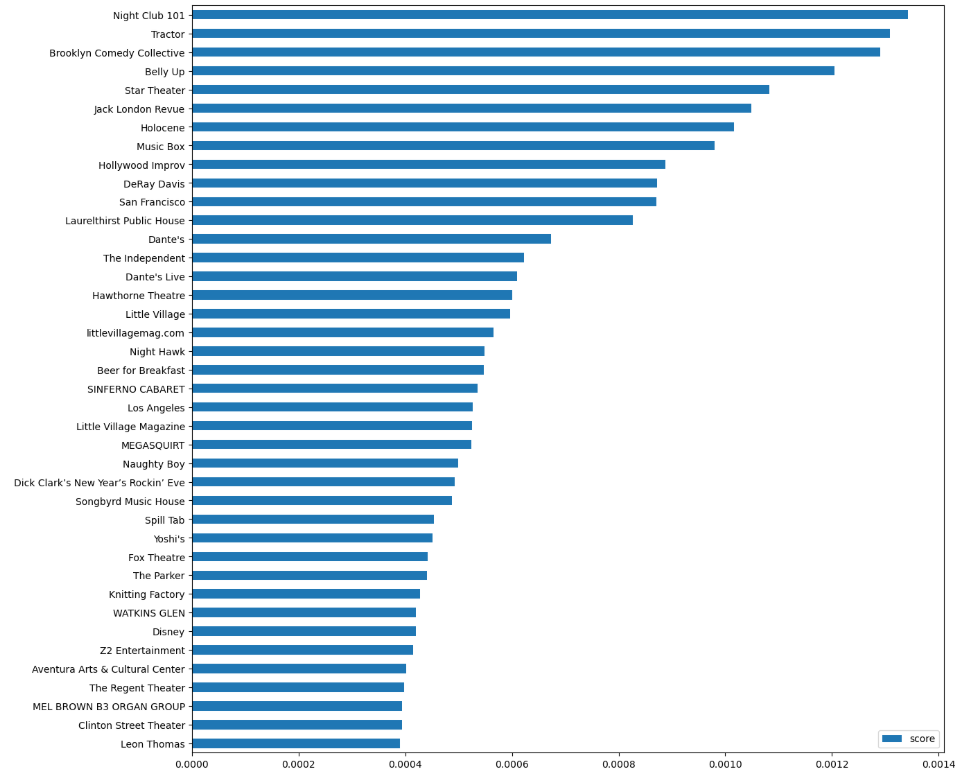
And this will be the starting point for our exploration, as I want to explore these big venues today. However, I do see one well-connected artist in there, Leon Thomas.
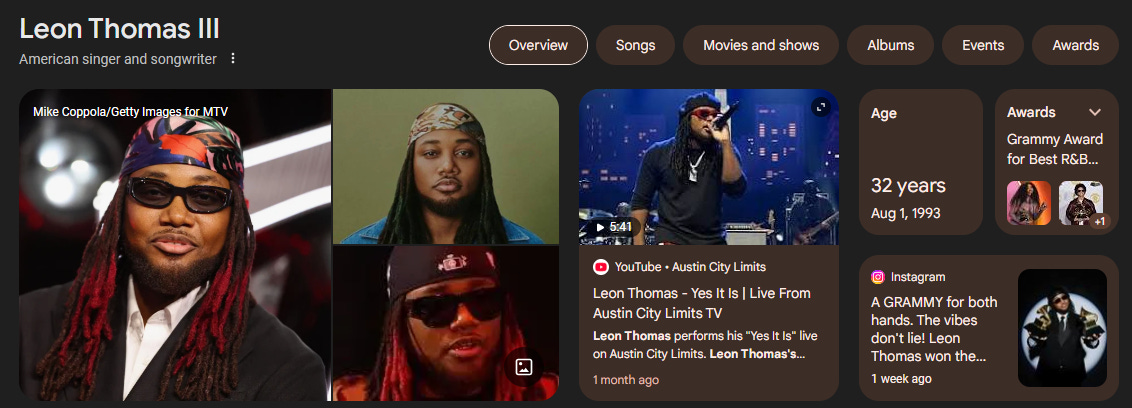
A simple Google search shows that we are in luck! We clearly have a list of venues and at least one well connected singer songwriter. This is going to be a fun exploration! Throw on some music (if that is your thing) and let’s go! This will be a cool combination of several of my favorite things: Natural Language Processing, Graph Analysis, OSINT, and Music. This is Music OSINT!
Start with Cosmograph
On Day 66, I wrote about this new collaboration data that we will be using today. Please have a read if you would like to learn how this data was created, which made this analysis possible.

To save time, you can also just click this link and get right to exploration.
Click Me! Check out Music and Art Collaborations!
If you click the link and wait a few seconds, a large network should render on your screen.
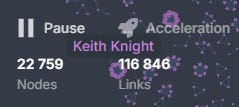
I can see that there are 22,759 nodes and 116,846 links. This is event collaboration data—past, present, and FUTURE. GrooveSeeker sees events that have happened and will happen. Check out the website. We are all GrooveSeeker.
If you click the Info tab and look on the bottom left, you can do searches like I am, and many more. I’m only going to look at a few of the 22,759 nodes.
Time to Explore. Let’s go.
Venue: Night Club 101
Actions Taken:
Click “Info”
Search for “Night Club”
Click “Night Club 101”
Click Analysis
Click “Isolate active selection”
Zoom way out until you see the nodes and zoom in to them.
I am going to shrink the node scale to as small as possible so that it is easier to see things. If I look up Night Club 101 in Cosmograph, this is what I see:
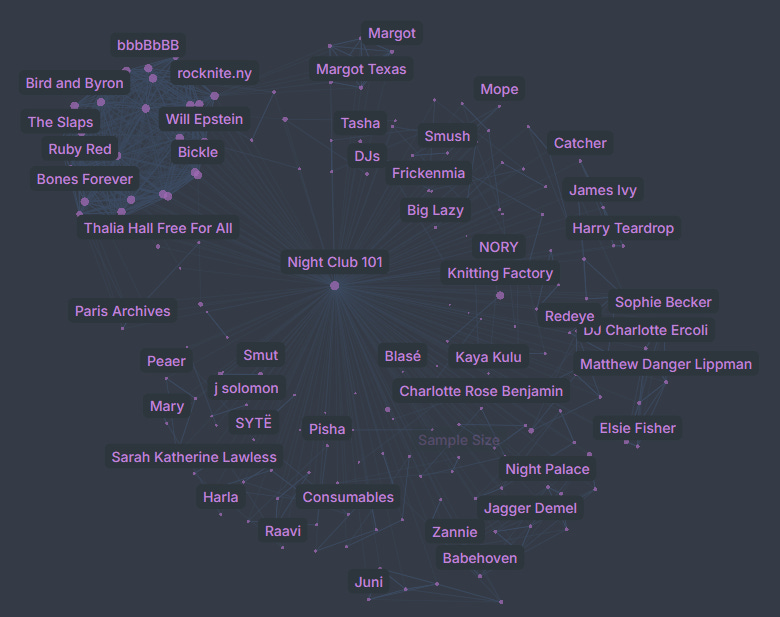
In a Graph Database, with a Knowledge Graph, Night Club 101 will have a very different appearance.
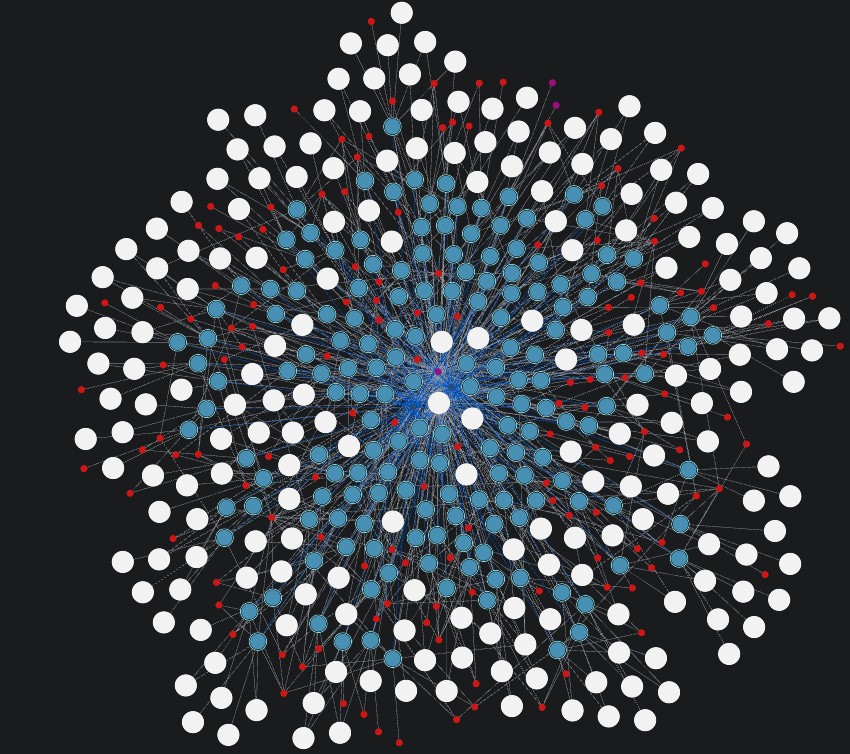
I’m not going to explain Knowledge Graph construction in this article. I want to show the differences. I will write more about KG construction, in future articles.
Thoughts:
Network Science is useful for capturing context about nodes (most popular, least popular, bridges, communities, structural change over time, etc).
Social Network Analysis is useful alongside Network Science. You should read my book and the earlier articles on this blog.
Graph Databases are very useful for storing and using Knowledge Graphs and are important in this AI age.
Venue: Holocene
Holocene is a popular nightclub and bar in Portland, Oregon. I should check them out.
In Cosmograph, Holocene’s Ego Graph looks like this.
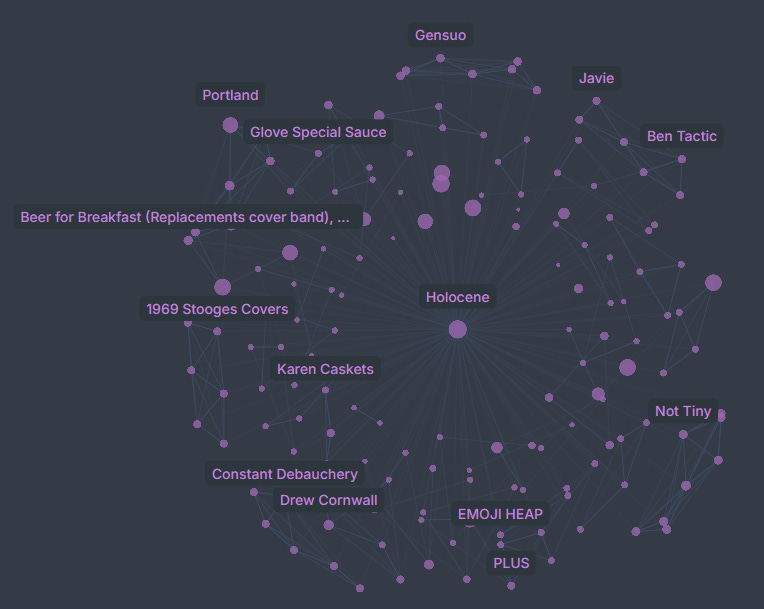
This is quite different than Night Club 101’s, as 101 had an interesting and dense subgraph on the top left of theirs.
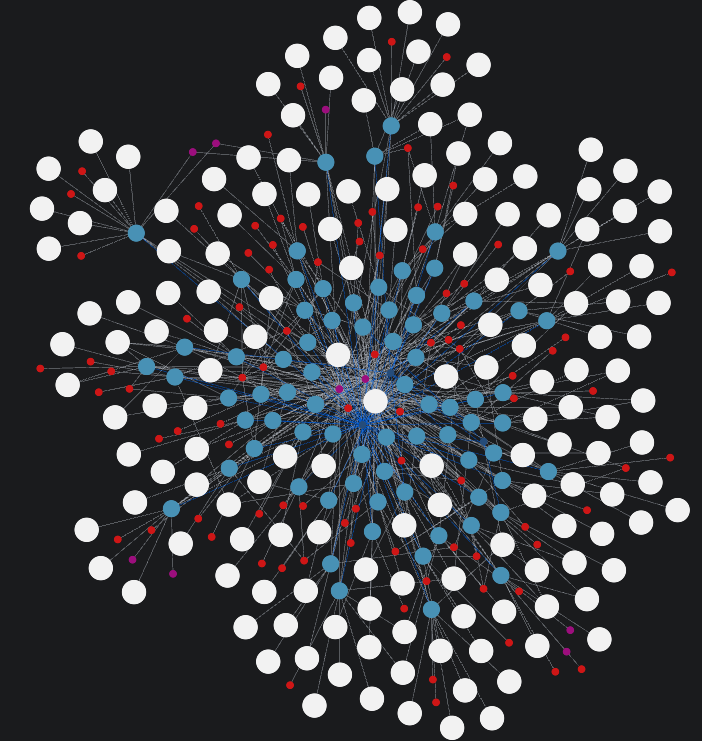
Their Knowledge Graph is a bit different than 101’s as well, as there are more purple location dots. If I look closer, I can see that there are mentions of bands from Seattle, London, and other places. They bring in artists from around the world! Cool insight! Simple Social Network Analysis would not have given me that insight. That insight came from exploring the Knowledge Graph in the Graph Database.
Artist: Leon Thomas
As we discovered, Leon Thomas is a well connected musician. Here are some links!
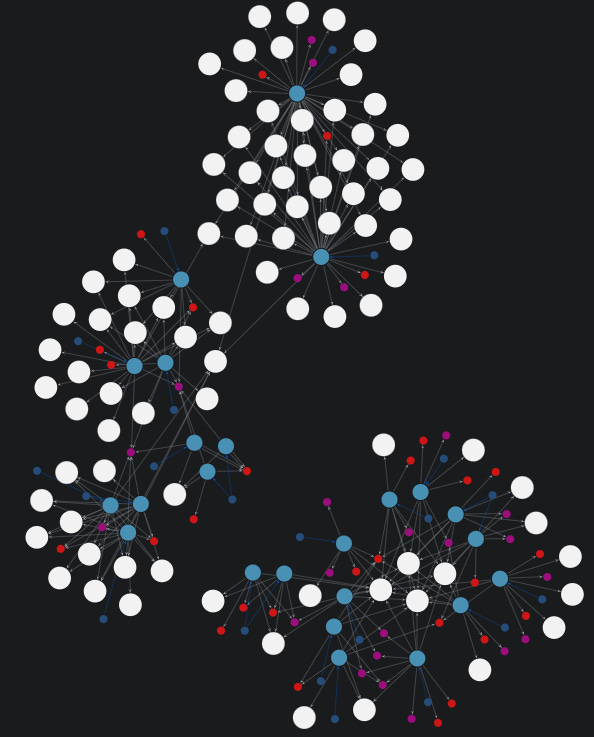
If I look for his Ego Graph in Cosmograph, this is what I see:

Dang. That’s impressive! Lady Gaga, Bruno Mars, Dark Star Orchestra, KPop Demon Hunters Trio, Lauryn Hill, Sabrina Carpenter. Enough said. That is one well-connected musician!
If I look at the Knowledge Graph, I see this:
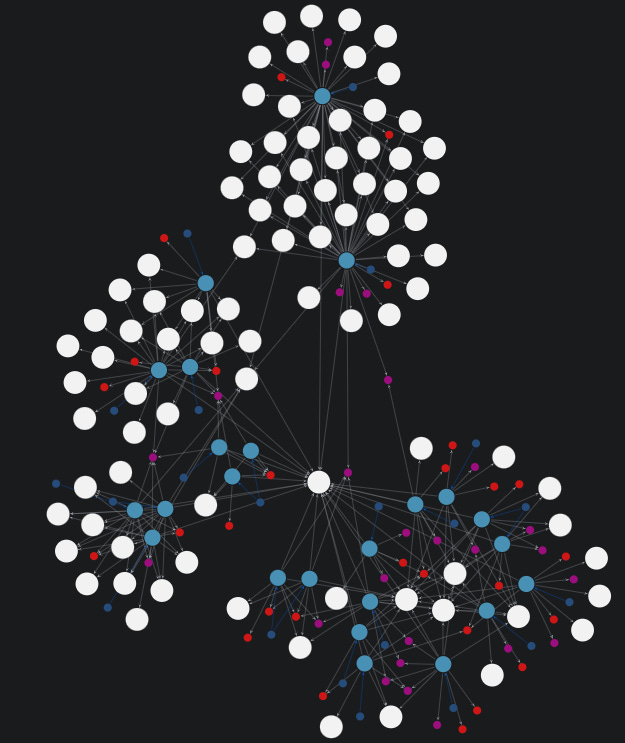
This collaboration graph is also very different from the others.
As he is an artist and not a venue, I see fewer events and more locations. He travels and performs at various places!
I am also impressed by how he seems to be a bridge between different communities. That is a structurally powerful position to be in, in any network.
In fact, if I remove his node and two location nodes, the graph splits into two! Neat! He is a bridge!
That’s All for Today
Substack has let me know that I have run out of space, so that is all for today! Please subscribe, and hit me up if you would like to buy access to the Living Library of Knowledge, to give your team or your AI agents better understanding of the real world.
Need to learn a lot from you!!
I'll admit I perked up a bit when Thalia Hall in Chicago was mentioned in one of those graphs. It's a venue in Chicago and it was pretty great! A lot of fun there. Same with the Salt Shed. I may need to poke at the graphs to check out those two.