
Day 65 of #100daysofnetworks
The Genesis Graph: My Origin Story

Hi everybody,
Today, I want to return to the very beginnings of my graph learning, to something I remembered while writing the first chapter of my upcoming book, Graph: Zero to Hero. This is going to be a non-technical post, but you can look at the code!
Eight years ago, I had an idea: I wanted to see if I could convert the TEXT of the book of Genesis from the Bible into a Social Network.
In English:
The Book of Genesis is the first book in the Bible, considered by many people to be the origin story of life on this planet. I do not agree with that, but it is neat text for analysis.
My idea was basically a question: Can I see a map of the relationships (families, friends, deities) if I convert the text into a Graph?
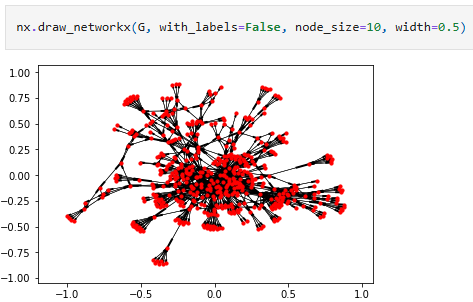
Yes, I can.
This image literally changed the entire course of my life. The code that generated this image can be found on one of my oldest repos. Here is the code and notebook!
When this image was generated, I worked in Data Operations. That means that my job consisted of:
Figuring out dataflows, and fixing things when they stopped flowing
Figuring out production systems, and fixing things when they stopped working
I didn’t come from the Social Sciences, nor am I religious. And yet, I took ancient scripture and turned it into a MAP. That was a breakthrough moment for me. Because I realized in that moment that a lot of overlooked data could become incredibly useful, if any text whatsoever could be converted into a graph. In fact, Day 44 is kind of a continuation of the work, using AI to convert any text into a Graph edgelist!

Let’s See Some More!
That first image was just a teaser. Let’s continue, it gets a lot better! This was eight years ago!
The next thing I did to this ancient graph was give it some breathing room.
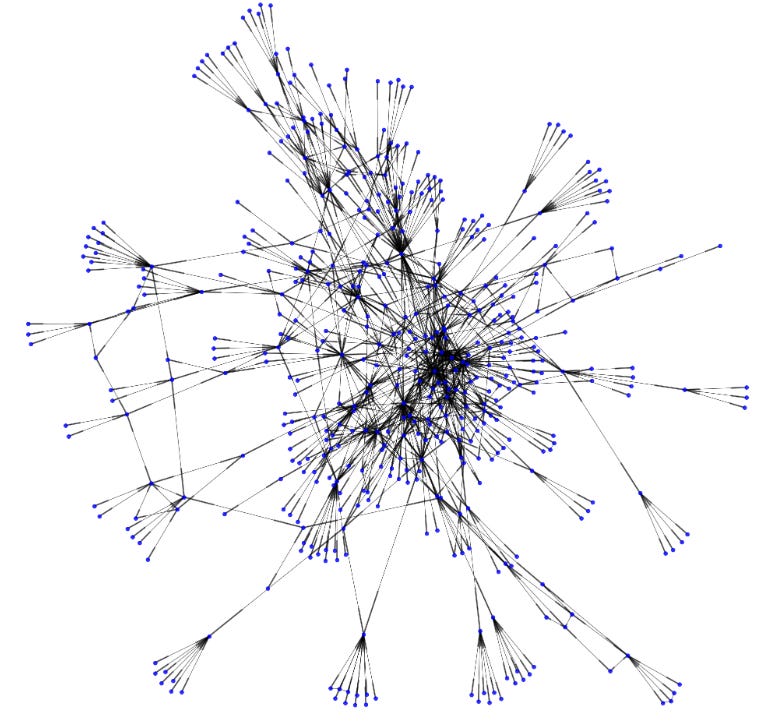
Much better! I can see that in this ancient network, there is a denser core, like we often see in social networks! This looks to me very similar to Power Law in action. A few nodes have a lot of connections, and most nodes have very few connections, a well-known phenomenon in Network Science.
Next, I wanted to give it some coloring and scale to make the nodes more meaningful.
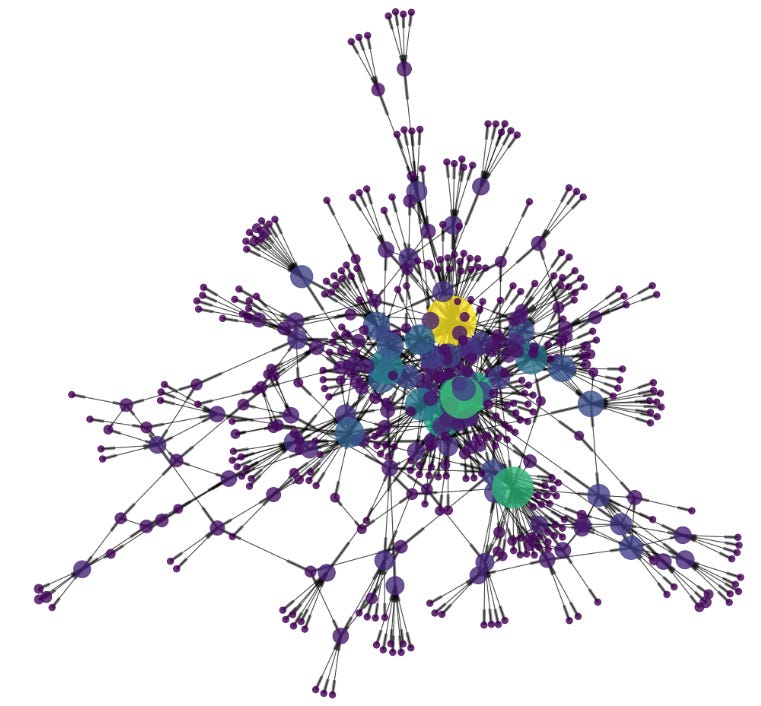
Honestly, I don’t feel that that worked out very well, in terms of making this more useful, but I will say this. This image right here started everything for me. This sealed the deal. After this, my life was changed. I could see the power of NLP and Graph together, and there was no looking back. This was eight years ago. And now, eight years later, NLP and Graphs’ synergistic value is being demonstrated by GraphRAG for reliable AI.
This is an extremely important image to me, and I’m sharing it with you. It’s not a particularly informative image, but it changed me. It just connected some last dot in my mind, eight years ago.
Important Entities in Genesis
Before I did this work, I used Graph in Data Operations to map out production dataflows between data centers around the world.
Read that sentence again to understand the significance of that. That means that nine years ago, I was using graph for Data Observability, back in my Intel and McAfee days. I loved that work so much, mapping out production systems, reverse engineering systems with GRAPHS.
So, by the time I made the Genesis graph, I was pretty comfortable with Network Science, just not with Natural Language Processing. So, it was pretty simple for me to identify key entities (people and deities) in the ancient text.
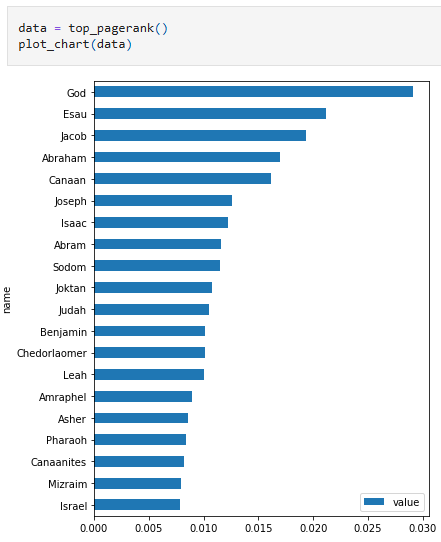
I used the same exact algorithm that was used by Google Search to identify the most important entities based on their connections. God is most connected, which makes sense. But Esau???? I still can’t believe that. That’s a cool insight. These cool insights never get old, they always make me want to look closer, check the data, and then if it’s right, my mindset is forever shifted.
By the way, you can do this with any text, not just the book of Genesis. In this blog series, we’ve done this with Alice in Wonderland, Jane Austen books, Wikipedia data, and more. But eight years ago, this all began with the book of Genesis, in terms of using Machine Learning and Natural Language Processing to convert text into graphs that can be explored.
Once the graph is built, it can be explored at your own pace. It is like a new world to play in, explore, and get to know. I am going to need to recreate this graph and explore it in Cosmograph. That’d be fun. Fun challenge! You try!
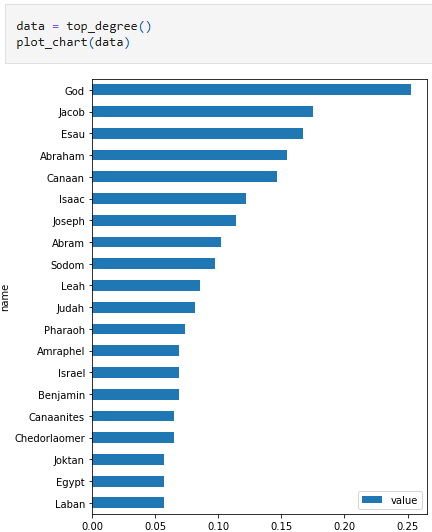
If we look at the graph based on its degree centrality, things change a bit. Jacob takes the lead from Esau. Other things have also adjusted. Look closely and try to notice the changes. What do you observe? Why do you think that happened? (These questions help you become a systems thinker. I don’t ask just for fun.)
There’s more to the notebook that you can explore, but I’ve shown all the screenshots I want to show.
Why Is This Important?
Why is this important? Why would anyone want to explore ancient social networks and learn about the past?
What kind of questions are those? This is science. This is about understanding the world and ourselves. How could anyone NOT want to dive into the past and learn about it? How could anyone NOT want to map out networks described in ancient literature and learn something about the world?
This is the beauty of the fusion of Computer Science, History, Computational Humanities, and more. I find so much fascinating stuff when I explore the bridges where disciplines collide.
When I figured this out, it was as if a whole new world had opened up. The ability to convert any text into a graph and explore it, it felt like the ultimate video game. I could learn a lot about whatever I wanted, and more than I would through reading alone.
I used to call this Cliffs Notes on Steroids, because I didn’t know how to describe it. It was more than a study guide. I could learn more about any book or speech or anything that I possibly could by just reading alone. I could poke it. I could play with the nodes. I could simulate what would happen if a node didn’t exist. What happens in Alice in Wonderland if the Red Queen gets to Alice? The whole network fragments, literally.
In fact, I show that kind of simulation on Day 22.
Anyway, this is important, because UNDERSTANDING is important.
Thank You For Attending My Tour!
I never know who actually reads these, but thank you to whoever does. I enjoy this work and research, and I enjoy writing about it. My goal isn’t to teach or explain. I prefer to demonstrate and show what is possible.
I wasn’t planning on doing this today. This was spontaneously written. I am going to do one spell check and then add it to the Information Superhighway (haha anyone remember that term from like the 90s?). :p
Thanks for reading. This was fun. I’ve been meaning to tell you this story for a while. I hope you have a great week.
Please Support this Work!
I have written over 60 articles for this series. Each one takes about four hours of research, and several pages of writing and editing. Here are some ways you can support the blog!
Please mention this blog to your friends and colleagues.
Please subscribe if you have not. This motivates me like nothing else!
BIGGEST HELP to the BLOG: Please consider upgrading if you are a subscriber. Thank you to all current paying subscribers for making this research and development possible! You can have Database access and minimal GraphRAG code if you want it.
Please buy my book to understand how I think about Natural Language Processing and Network Science combined.
I will open up early access to my second book Graph: Zero to Hero very soon. Please stay tuned.
Platform access to the Living Library of Knowledge is opening, NOW. Please let me know if you are interested in access.
Please reach out to me if interested in training related to Data Science, Data Engineering, Network Science, Knowledge Graphs, Artificial Intelligence, or anything else I write about. Feel free to message me on Substack or on LinkedIn!
Feel free to hang out in the comments and have a good time!
We have come so far since the very first day of the very first #100daysofnetworks. I love writing for this series. Thank you for being a part of it!
A perfect example of "Data is beautiful"!