


Day 42 of #100daysofnetworks
Cosmograph: "No Code" Graph Visualization at Million Scale!

I am ALWAYS on the lookout for better graph visualization software. Since I began this journey in about 2017, I have gone through several iterations of finding better and better graph visualization software. There are several options, but very few that scale large enough to be useful on real-world networks.
Today, I am introducing Cosmograph’s No Code solution for Graph visualization and inspection! I think this is a really important capability that will allow non-coders and other less technical folks to get the same enjoyment at inspecting network graphs.
What Is This?
This tool enables ANYONE to do interactive graph visualization and inspection.
This tool allows you to visualize and interact with very large graphs. It also has some other cool features, such as the ability to extract and inspect a part of the graph (subgraph), separately, and a lot more. Read about it here.
Why Does it Matter?
This is really useful to me, because I don’t always want to programmatically analyze a graph. That takes a lot of work to do well. This doesn’t replace graph analysis, and it doesn’t really replace every other tool for graph visualization, either. It is a shortcut for whole network visual inspection. It can save you a lot of time. If you have graph data, you can upload it and inspect it in seconds.
How Do I use It?
This is very easy to use. I have generated a few files to get you started, using networkx’s graph generators. You can download the files here. You can also use any of the 100daysofnetworks datasets from previous days, though any that involve bipartite projection will require some preprocessing to get it into a suitable format for this tool.
I recommend downloading one of these files (click the download icon on the right):
les_miserables.csv: This is social network from the book Les Miserables. It is a very small graph, allowing you to inspect how this tool does with smaller datasets. It is also a bit more interesting than the other two files, as the nodes are characters, not just numbers.
scale_free_100k.csv: Cosmograph says that it can handle million scale, but I wanted to see how well it could do with 100,000 nodes. This is already much more than many tools can handle. This is a scale-free network, which you can read more about here.
scale_free_200k.csv: Cosmograph handled 100,000 nodes with ease, so I wanted to see how it could do with 200,000. No problem!
To download a file, look for this download icon on the github page:

Just save it somewhere that you can find for the next step.
Show and Tell
For the rest of this article, I will walk you through the first steps and give you some tips. I want to stay out of your way. I want you to get excited to play with this tool, and then I want to leave you alone to be creative and have fun.
First, go to https://cosmograph.app/run/
Bookmark this page. I have been using it all week on several different datasets and really enjoying it. Put it somewhere easy to access to make it easier for you to find.
Next, click on the words “Load Graph”.

Next, click “Select data file”. This can be any file that appears to be a network edgelist, but you are currently limited to .csv, .tsv, and .ssv.

Next, just click “Launch”. You can check out the other options as you go.

Now, wait about three seconds and the graph will appear on your screen.

This is an interactive graph, so you can zoom in with your mouse. Also, look at the top right of this image. This is a graph of 100,000 nodes and 193,059, much larger than most toy graphs. This is bigger than many real networks. This tool is powerful. Let’s zoom in a bit.

I can already see a key characteristic of scale-free networks. Most nodes have very few connections, and very few nodes have many connections. We can see an example if I zoom in on one of those blue blobs.

And we should be able to see things a little better if I reduce the node size a bit. On the left, look for “node scale” and move the slider bar until it is about 0.3. Then it will look something like this:

It looks like node 10731 might be the node that the surrounding nodes are connected to. I’ll show how to extract a subgraph a bit later. Please keep reading.
This tool can handle large graphs, but let’s use the Les Miserables graph, as it is a bit more interesting and relatable, having to do with people and how they know one another. If I load the file, here is what I see.

The structure is there, but it needs a little work. Let’s reduce the node scale to 0.3.

Let’s also increase the “link scale” to 2. Push the slider all the way to the right.
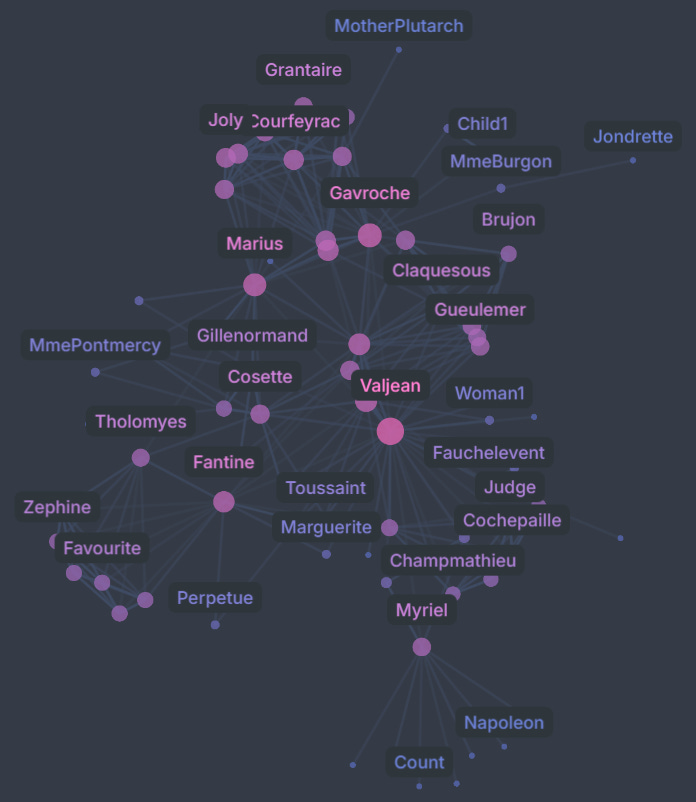
That’s a lot better, as I an more easily see the noes and edges.
Inspecting Subgraphs / Egos
One feature that makes this tool so useful is that you can easily pull out parts of the graph for inspection. Just for review:
A subgraph is a part of a graph. Imagine using a slicing tool and just grabbing the top 25% of the image. You would have selected a part of the graph, a subgraph.
An ego network is a special kind of graph consisting of an ego (the node of interest) and the alters around it (who/what it is related to).
I use ego graphs very, very often, so I will show how to capture one using this tool.
First, click on the Valjean node.

Notice that it has already faded out the non-related nodes in the background.
Next, on the left side tools, click into Analysis and then click “Isolate active selection”.

Then click the center icon on the top left. I have added extra red squiggles to make it easier for you to find. It isn’t obvious, and it is useful.

Then zoom in and out and apply whatever node/edge formatting you want.
That’s it. I don’t want to say more. I want you to play with this and let me know what you think. This opens up graph visualization and investigation to non-coders and less technical folks. This democratizes graph analysis and makes it more accessible.
What Are You Going to Do?
I’ve written dozens of articles, showing many ways that Graph Analysis is useful. Hopefully, my writing has given you some ideas for using it in your own life and work. What are you up to? What are you using it for, or thinking about using it for? Have an idea and you need someone to hear you out? Do something with this!
Begin where you are. In order to find usefulness, you have to start using this, and learning from the insights you discover. Let me know if you get stuck. I challenge you to start playing with graphs on your own a bit. Please read my old articles or my book if you want to get back to the basics.

That’s All for Today
Special thank you to Sergey Mastitsky for turning me on to Cosmograph! I’m really grateful to my LinkedIn network and have learned a lot from my connections! Likewise, if you learn about or know of anything that can be helpful with #100daysofnetworks or graph analysis, please let me know, so I can play with it and possibly introduce others to it, like I am doing with this short article.
Thanks to everyone who has been following along with this series. Happy learning! If you would like to learn more about networks and network analysis, please buy a copy of my book!