


Day 40 of #100daysofnetworks
Knowledge of Graphs: Convergence of Concepts

Merry Christmas and Happy Holidays, everyone. I had a really nice time with my family and am enjoying some downtime, building up my energy for an exciting 2025.
Today, I have an interesting post for you. There is a lot of knowledge contained in graphs (thus the term Knowledge Graph), but you must be able to get to it and interpret it in order for the insights to be discovered and made use of.
For this article, I wanted to try to understand the convergence of concepts. In other words, what do Concept A and Concept B have in common? More specifically, I want to understand where the concepts of Network Science converge with Artificial Life (ALife).
What is Artificial Life?
I ran into the phrase Artificial Life while reading the book The Ascent of Information. I’ve known of researchers who have made simulations of life, but I never really thought of it much as an approachable topic of research until reading this book. Then I realized, I did my own Artificial Life simulation about six years ago when I was attempting to mimic a certain behavior of fireflies that I read about in the book Sync. Neat, I have already dabbled. I would like to learn more.
Here is Wikipedia’s current definition:
Artificial life (ALife or A-Life) is a field of study wherein researchers examine systems related to natural life, its processes, and its evolution, through the use of simulations with computer models, robotics, and biochemistry. The discipline was named by Christopher Langton, an American computer scientist, in 1986. In 1987, Langton organized the first conference on the field, in Los Alamos, New Mexico. There are three main kinds of alife, named for their approaches: soft, from software; hard, from hardware; and wet, from biochemistry. Artificial life researchers study traditional biology by trying to recreate aspects of biological phenomena.


== Overview ==
Artificial life studies the fundamental processes of living systems in artificial environments in order to gain a deeper understanding of the complex information processing that define such systems.  These topics are broad, but often include evolutionary dynamics, emergent properties of collective systems, biomimicry, as well as related issues about the philosophy of the nature of life and the use of lifelike properties in artistic works.
This is very interesting. We hear so much about Artificial Intelligence, but not nearly as much about Artificial Life. In my opinion, it is useful to understand both, and the understanding of both will be used together. If you want to create an artificial life, you will need to give it an artificial intelligence. So, I’m not fond of AI getting all the attention, and I would like to learn more about ALife. Network Science has been helpful in learning more about ALife, and I have written about this on prior days.
First, Code
Here is the code for today’s analysis. For this investigation, I used Polars instead of Pandas for any preprocessing, as I wanted to familiarize myself a bit more with the language. I am still a beginner with Polars, so please forgive any gnarly code. I am really impressed with the speed of Polars, and so far, I don’t see any reason it can’t replace Pandas for Graph Analysis work.
Polars is very fast, and you can learn more here.
Not an Ego Graph
If you’ve read my book or followed this blog, you have seen Ego Graphs before. In an ego graph, you can visually inspect the network that exists around ONE “ego” node. The nodes around it are called “alter” nodes.
Ego graphs are very, very useful for cutting through the noise of any graph. We typically have an idea of what we are looking for in a graph, so an ego graph is a good place to start. And if we don’t know, then centralities or page rank is useful for identifying important nodes in any graph, and these central nodes can be inspected with ego graphs.
Here is the ego graph for Artificial Life. The center node is the “ego” and all other nodes (dots) are called “alters”.
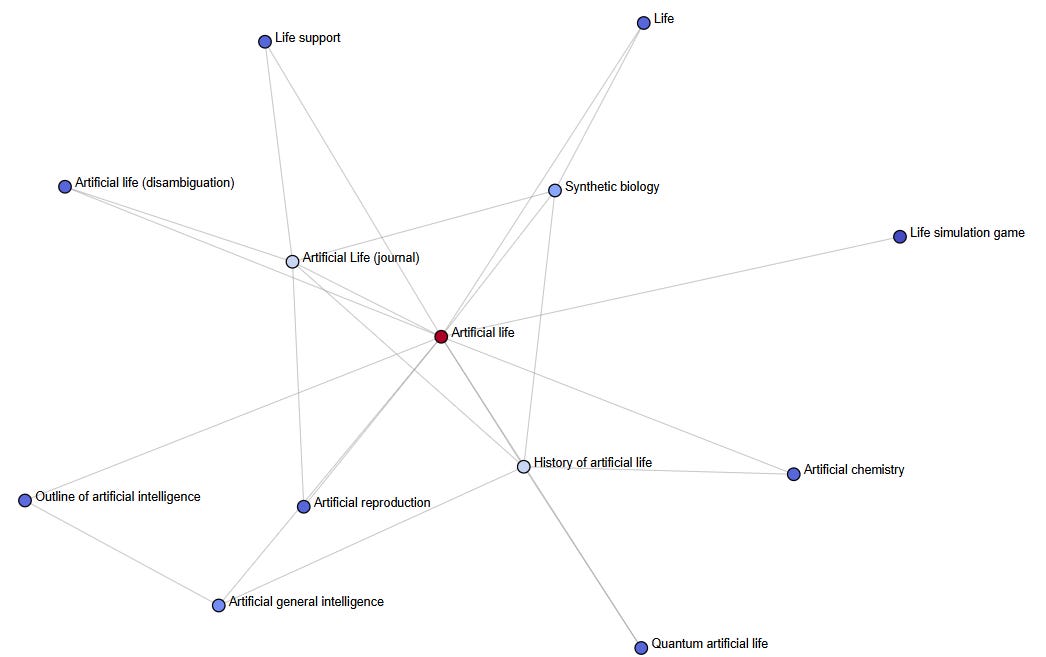
Nice. That’s pretty useful. I see some interesting concepts that can be investigated:
History of artificial life
Synthetic biology
Life simulation game
Quantum artificial life
Artificial Reproduction
Artificial General Intelligence (AGI, yup)
But, I can’t see where ALife converges with Network Science. I need something different than an ego graph for this.
Here is the Network Science ego graph, for comparison.

I can’t see any connectivity to Artificial Life. I need something else.
Trying Something New
I don’t even know what to call this. Maybe a convergence graph? Perhaps, someone else has already given this a name. But I do know what I want, and you can see in the code how I got to it. But for simplicity sake, here is my methodology:
Pull a wikipedia dataset using the Day 5 wikipedia edgelist builder.
Build the graph using the dataset.
Calculate the distance of every node to the Artificial Life node.
Calculate the distance of every node to the Network Science node.
Calculate the average distance between both.
Use this average distance of both to attempt to see where topics converge.
This above methodology is pseudocode. Without using my code, you can attempt to write your own code using this above methodology. But if you are unfamiliar, please follow along with my code. It is provided in each of these articles.
How does this new topic convergence graph look?

This is cool and exciting to me. You can think of it as similar to a Venn diagram, but much more complex. It takes work to understand, like any graph. But this is exciting to me, because I have never seen or done anything like this before. I can clearly see how Network Science, Artificial Life, and Artificial Intelligence connect.
Here’s a mental tip: look for the regions.
If you look at the middle left, most nodes have to do with Artificial Intelligence, but it is connecting to Network Science through the nodes KL-ONE, Efficiency, and Quantum Dot stuff.
The Network Science region is on the top right. It is connecting to Artificial Life through the nodes relating to Artificial Chemistry and Artificial Photosynthesis.
The Artificial Life region is on the bottom right and parts of the bottom left. It connects to Artificial Intelligence through Artificial Chemistry.
This is cool discovery work. Here are all of those nodes from this graph:
Artificial Life (journal)
Artificial chemistry
Artificial general intelligence
Artificial intelligence
Artificial life
Artificial life (disambiguation)
Artificial photosynthesis
Efficiency (disambiguation)
Efficiency (network science)
Efficiency Medal (disambiguation)
Energy Sciences Network
Frame (artificial intelligence)
Graph (discrete mathematics)
History of artificial life
Immune network theory
John M. Jumper
Joint Center for Artificial Photosynthesis
KL-ONE
Lawrence Berkeley National Laboratory
List of Nobel laureates
List of unsolved problems in chemistry
List of unsolved problems in mathematics
Network science
Network theory
Niels Kaj Jerne
Outline of artificial intelligence
Percolation (cognitive psychology)
Quantum artificial life
Quantum dot
Quantum dot solar cell
Semantic network
Semantic social network
Solar-cell efficiency
These are all Wikipedia pages, and you can access them programmatically, as I have shown in the code. You can programmatically pull content and links from any of these pages.
The maximum distance threshold can be increased to analyze a larger similarity graph. I have left labels off of this next one, but you can see that there is more complexity. You can play with it using my code.

Train your eyes to look for “clumps” or clusters of nodes. These are small ecosystems with a lot going on. Also, I color nodes by their Page Rank score, so you can easily spot important nodes. This is a useful thing to do, but less useful without labels.
What’s the Takeaway
I get that graphs can be intimidating to look at if you don’t know HOW to analyze them. I’ve tried to simplify this for you, but you have to actually do the work to build the skill and confidence. You will if you do.
For me, the takeaway is that there is a way to inspect where ideas converge, and we can learn from this knowledge. For instance, I know that Network Science fascinates me, and I am intrigued by Artificial Life. However, I don’t have ALife researchers banging down my door, begging me to do something with them. And ironically, the Network Science community doesn’t seem all that into networking. This above technique makes ALife accessible to me. It gives me a place to start. You find the first dot that catches your attention, learn about it, learn what concepts it leads to, and then follow them to the next thing.
Concept > Concept > Concept > Concept > Concept
You don’t begin at the end, as some kind of mad scientist capable of fusing Graph-enabled Artificial Intelligence to some Artificial Life organism.
So, for me, that means I’d probably enjoy reading about Artificial Chemistry, Artificial Photosynthesis, the two people named in the graph, and learning about other nodes.

This is Unlimited
This is not limited to the two topics of Network Science and Artificial Life. You could do this with Country Music and Heavy Metal. I bet that’d lead to some interesting places. You can do this with any topics that interest you.
And you are not limited to TWO. You could extend this idea to THREE or more. But the more you add, the more difficult it will probably be to analyze, maybe. Or maybe it will work really well. I don’t know! Try it!
This has to do with understanding what we want to understand. It democratizes information. It highlights the unknown unknowns and makes them known. There were almost 7000 nodes in this graph, and we found the 33 that helped answer the research question of what connects Network Science to Artificial Life.
What Are You Going to Do?
I’ve written dozens of articles, showing many ways that Graph Analysis is useful. Hopefully, it has given you some ideas for using it in your own life and work. What are you up to? What are you using it for, or thinking about using it for? Have an idea and you need someone to hear you out? Do something with this!
In order to find usefulness, you have to start using this, and learning from the insights you discover. Let me know if you get stuck. I challenge you to start playing with graphs on your own a bit. Please read my old articles or my book if you want to get back to the basics.
That’s All for Today
Today is day 40, a milestone day! I was hoping to hit day 40 before 2025, and we did it! Thank you to everyone for following along. I hope some of you are learning from this, but learning can even just be awareness. This is possible. People do this. It is useful and relates to Artificial Intelligence, Artificial Life, reality, everything. Everything is connected, so the ability to analyze networks is a very important and powerful skill, and it only seems like magic because it isn’t popular. It is easy to do, with practice. It feels good and is always exciting and educational.
Thanks to everyone who has been following along with this series. Happy learning! If you would like to learn more about networks and network analysis, please buy a copy of my book!