Today is going to be a fast post. Hopefully there won’t be too many typos. I have very little time today but wanted to do something that I’ve had on my mind for a while. If you have read my book or other network analysis books, you have probably heard of community detection. If you haven’t, I recommend you go back and read some of my earlier blog posts in this series.
Today, I’m using community detection, doing more. I am building the first steps of a detection approach to detect denser, more interesting communities, not just star graphs.
There are three steps to this:
Identify the communities, using community detection algorithms
Capture community context
Investigate communities of interest
Get the Code
You can get today’s code here. Follow along with the code to understand how I have done the above three steps. Step two is the new stuff.
First Look at Results
The first thing I did after collecting community context was to draw a histogram of each community’s network density, the amount of connectivity in the community, how connected the nodes are to each other.
This shows something interesting. There are some communities where everybody knows everyone else. That is the bar right above 1.0. The communities have a density of 1.0 because all nodes in the community are connected.
But if you ignore than 1.0 line, you see interesting behavior. This shows that most communities had a density between 0 and 0.4, and fewer between 0.4 and 0.6, and fewer between 0.6 and 0.8, and still fewer between 0.8 and 1.0.
Each one of these density slices can be investigated separately. If you know how to work with networks, you can have a lot of flexibility in your analysis.
Today, I looked at communities with a density between 0.4 and 0.8 Here is how they look. Let’s look at a few.
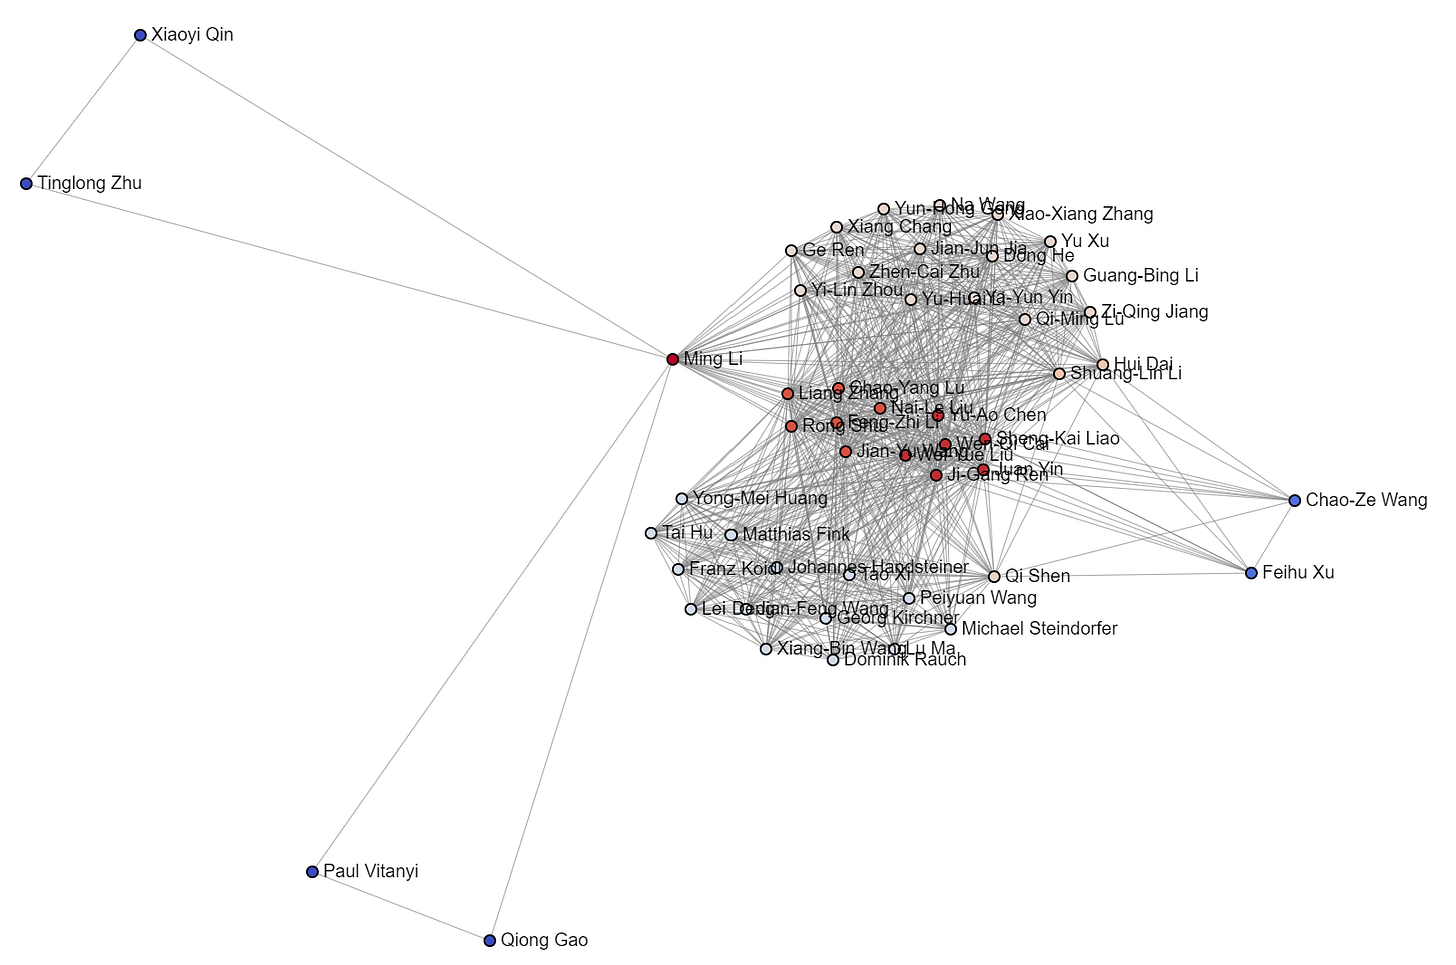
That’s neat. There are three groups in this community.
Another cool three group community.
Nice. This is closer to what I was looking for. I wanted interesting communities.
And another interesting one.
And another.
Today, I just wanted to take a first attempt at this. This is a combination of data science and network science. The density stuff comes from network science, the Pandas work comes from data science, and everything else is software engineering.
Being able to have total flexibility with networks is powerful. That’s all I will say, today. I have to run.
That’s All, Folks!
That’s all for today! Thanks for reading! If you would like to learn more about networks and network analysis, please buy a copy of my book!


